inventories are the most comprehensive source of state-level
emissions data. The latest data show that as of 2024, Tasmania remains net-zero and the rest of the country is making progress on emissions reduction – albeit not fast enough. So, while there’s more we can and should be doing, the results are more encouraging than the broader international picture.
For the past five years, the TPEhas published
independent analysis of the annual emissions inventories. This is our second PIMBY analysing Tasmania’s emissions based on the STGGI. Below, we’ll look at Australia and Tasmania’s recent emissions-reduction performance and identify some opportunities for improvement. You can find the full version of our analysis
here.
The national picture
At the Australian level, there are grounds for cautious optimism. The
latest National Greenhouse Gas Inventory Quarterly Update reports that emissions in the year to December 2025 were down 2.1% compared to 2024, and 24.5% below 2005 levels. The main thing driving this has been the gradual decarbonisation of electricity generation, as renewables continue to replace fossil-fuel generation in the National Electricity Market.
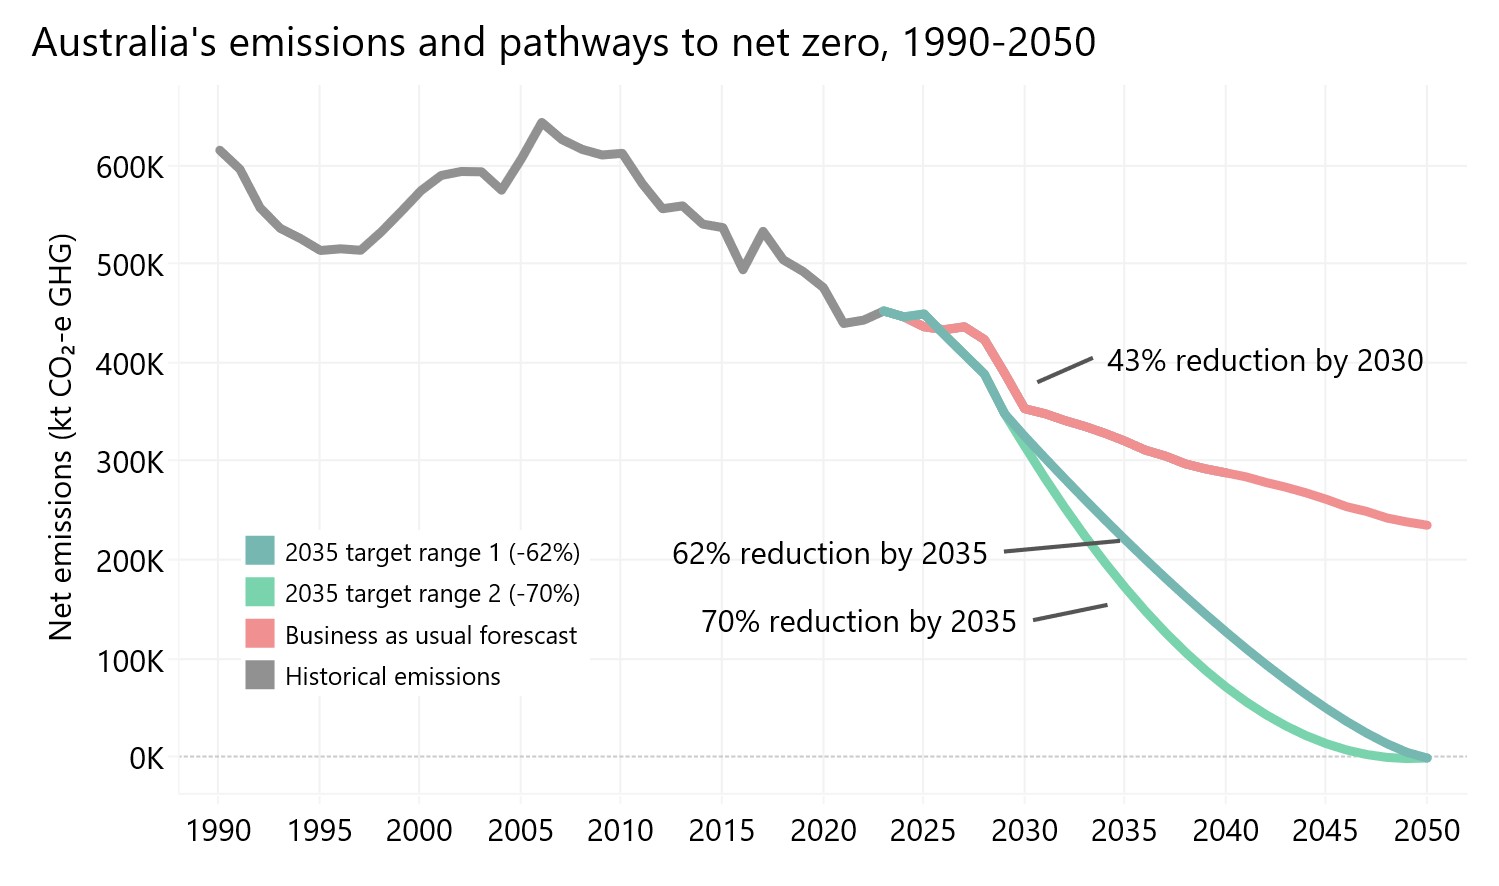
If we keep cutting emissions at around this rate, Australia should hit its
Paris Agreement target of reducing emissions by 43% below 2005 levels by 2030. But it gets a lot harder after that. If we want to achieve the Federal Government’s
recently updated target of reducing emissions by 62-70% by 2035 – let alone net zero by 2050 – we really need to pick up the pace. Continuing our current trajectory will see Australia fall short of net zero in 2050 by around 236 million tonnes. To help highlight the scale of the task that lies ahead, this is roughly the equivalent of every Tasmanian taking 239 return flights from
Hobart to Bali.
Tasmania's tenuous net-zero status
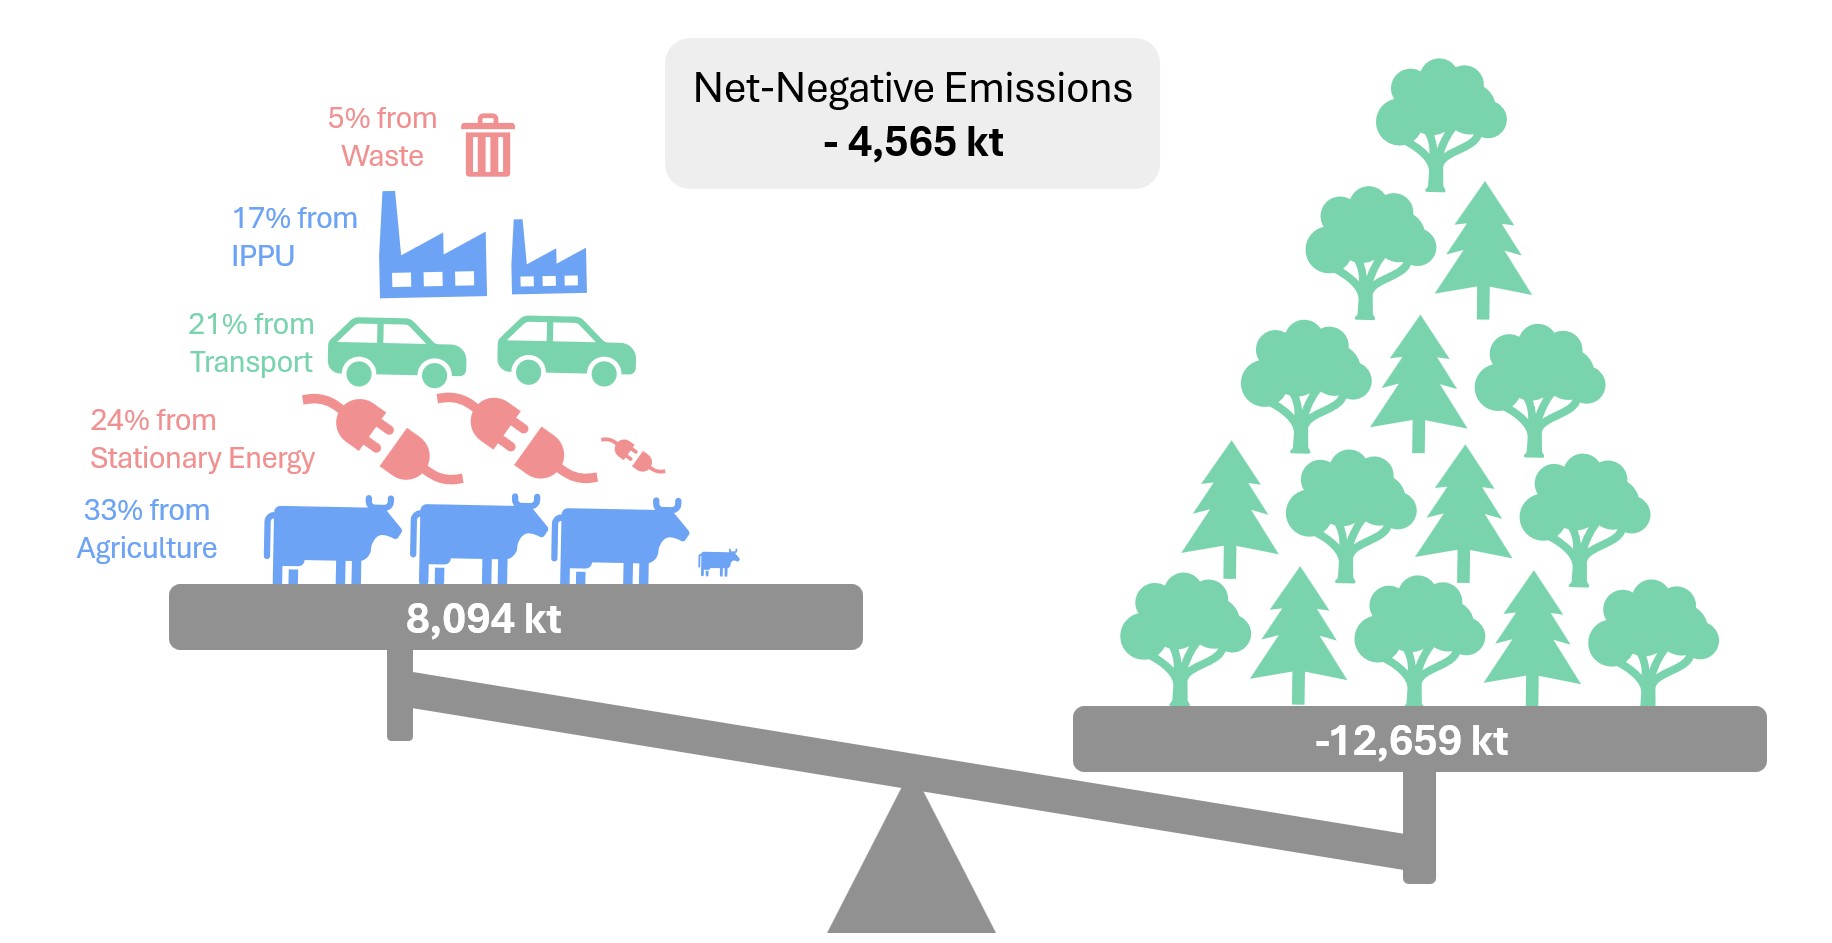
The headline from the latest STGGI is that Tasmania still has net-negative emissions in 2024, meaning we continue to remove more carbon from the atmosphere than we emit. This has been the case now for more than ten years – although our 2024 result is a bit worse than the previous year.
We largely owe our net-negative status to two factors. The first is our renewable electricity system, which keeps our energy emissions low. The second is the decline in native forest harvest levels (especially from private native forests) during the early-2000s, which led to a dramatic fall in emissions from the Land Use, Land-Use Change, and Forestry (LULUCF) sector over the following decade.

Tasmania’s biggest concern for the future is that our net-negative status remains almost entirely reliant on removals and sequestration.
Our ‘absolute’ emissions – that is,
our emissions from all sectors other than LULUCF – have barely moved in 30 years. While other states have worked hard to reduce emissions from transport, energy, industry, and agriculture, Tasmania has instead
relied on its forests to do the heavy lifting.
That approach cannot continue indefinitely. The rapid decline in Tasmania’s native-forest harvest caused a big bump in our LULUCF removals because young or recently harvested forests draw down carbon quickly due to vigorous growth. As these forests approach maturity, however, the rate at which they absorb carbon dioxide will slow down.
If we can’t do better reducing emissions from other sources, we’ll gradually return to net-positive emissions over time. Our LULUCF removals should be understood as a limited window of opportunity rather than a permanent, reliable buffer.
Comparing 'absolute' performance
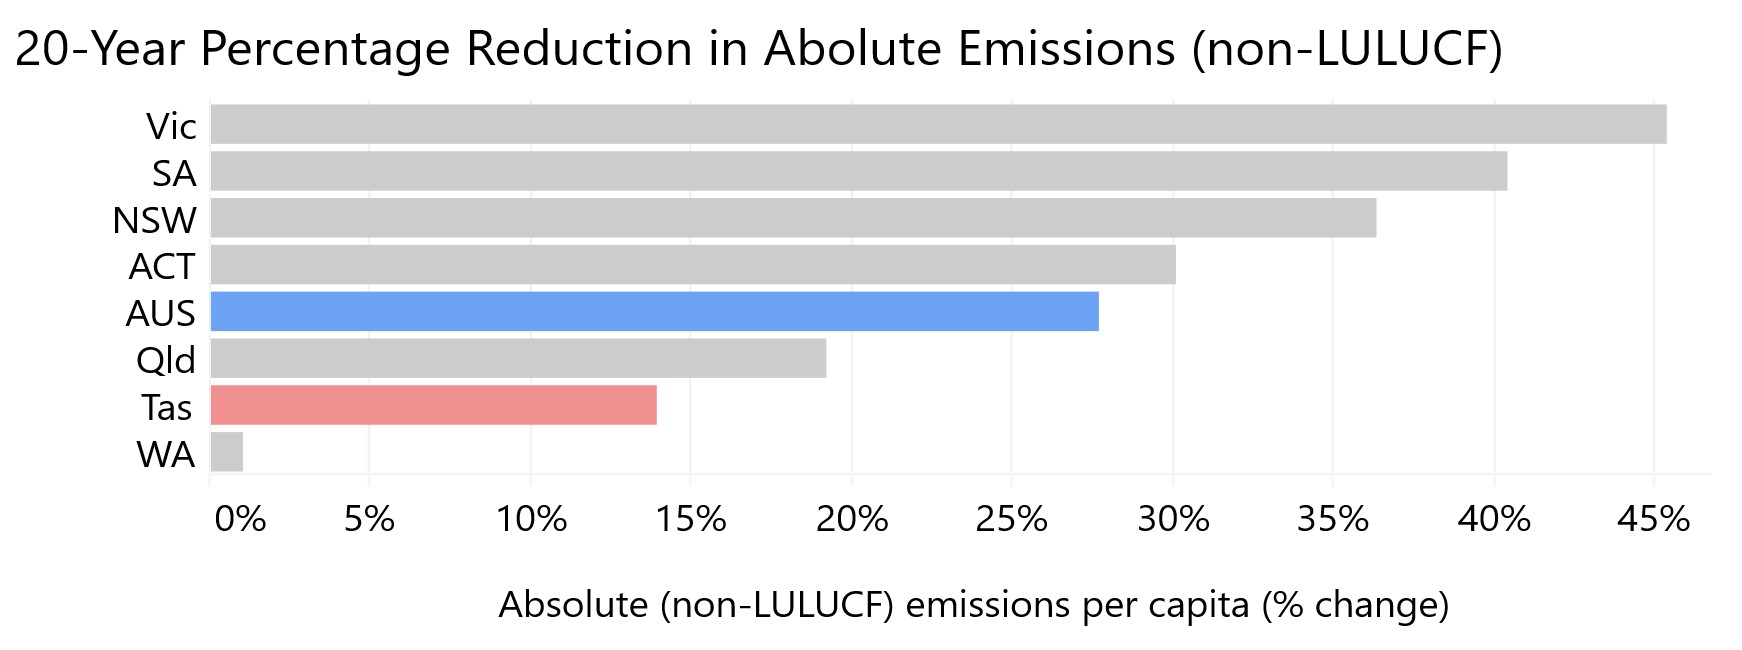
Net emissions are the best measure of overall contribution to global warming, but they’re not always a good indicator of emissions-reduction policy success. To gauge how hard a state is working to reduce emissions, it’s more useful to look for changes in the ‘absolute’ (i.e., not including removals and sequestration) emissions per capita. A sustained reduction in this figure generally indicates serious effort to rein in fossil-fuel use and other greenhouse gas (GHG) pollution.
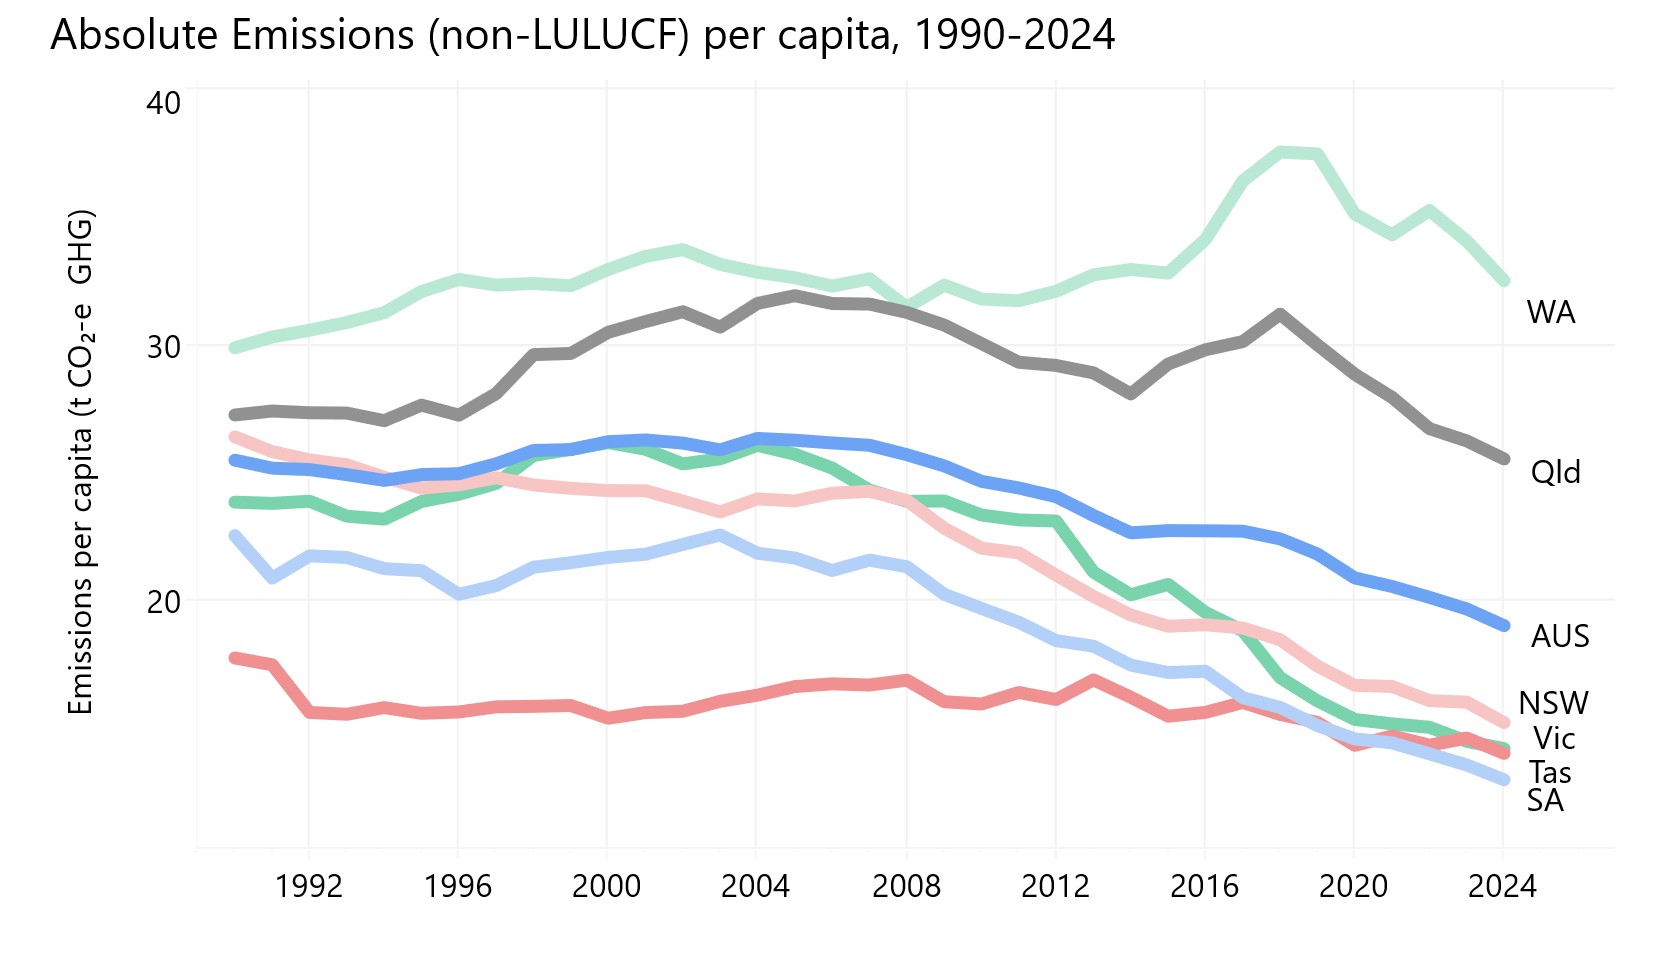
Tasmania once had the lowest absolute emissions per capita in the country by a wide margin (excluding the ACT) but we’re quickly being overtaken by other states. South Australia has already got the better of us, and Victoria and New South Wales are on track to do the same. Victoria nudged slightly ahead of us in 2023 and we’re neck and neck in 2024.
Tasmania's performance over the past two decades has been poor compared to other states. Since 2005, Victoria has reduced its absolute emissions per capita by 45.4%, South Australia by 40.4%, and New South Wales by 36.4%. We managed just 13.9% over the same period.
It’s important to note that the states overtaking us have been able to make large reductions because they still rely heavily on fossil-fuel electricity and we don’t. By starting to decarbonise their energy systems and embrace renewables, Victoria, South Australia, and New South Wales have made major progress on emissions reduction.
However, they’re also reducing emissions in other sectors. For example, NSW and Victoria have absolute emissions per capita on par with ours even though they still get around 60% of their electricity from coal power stations. By the time these states reach anything like the renewables penetration we enjoy in Tasmania, they’ll have long since left us in their dust on an absolute emissions per capita basis.
Getting into the detail
Overall emissions figures are important, but it’s once we look a bit deeper that things get really interesting. The STGGI breaks emissions down by sector, showing where progress is being made and where our biggest opportunities for further reductions are. Agriculture, transport, and industrial processes and product use (IPPU) are the big three for Tasmania.
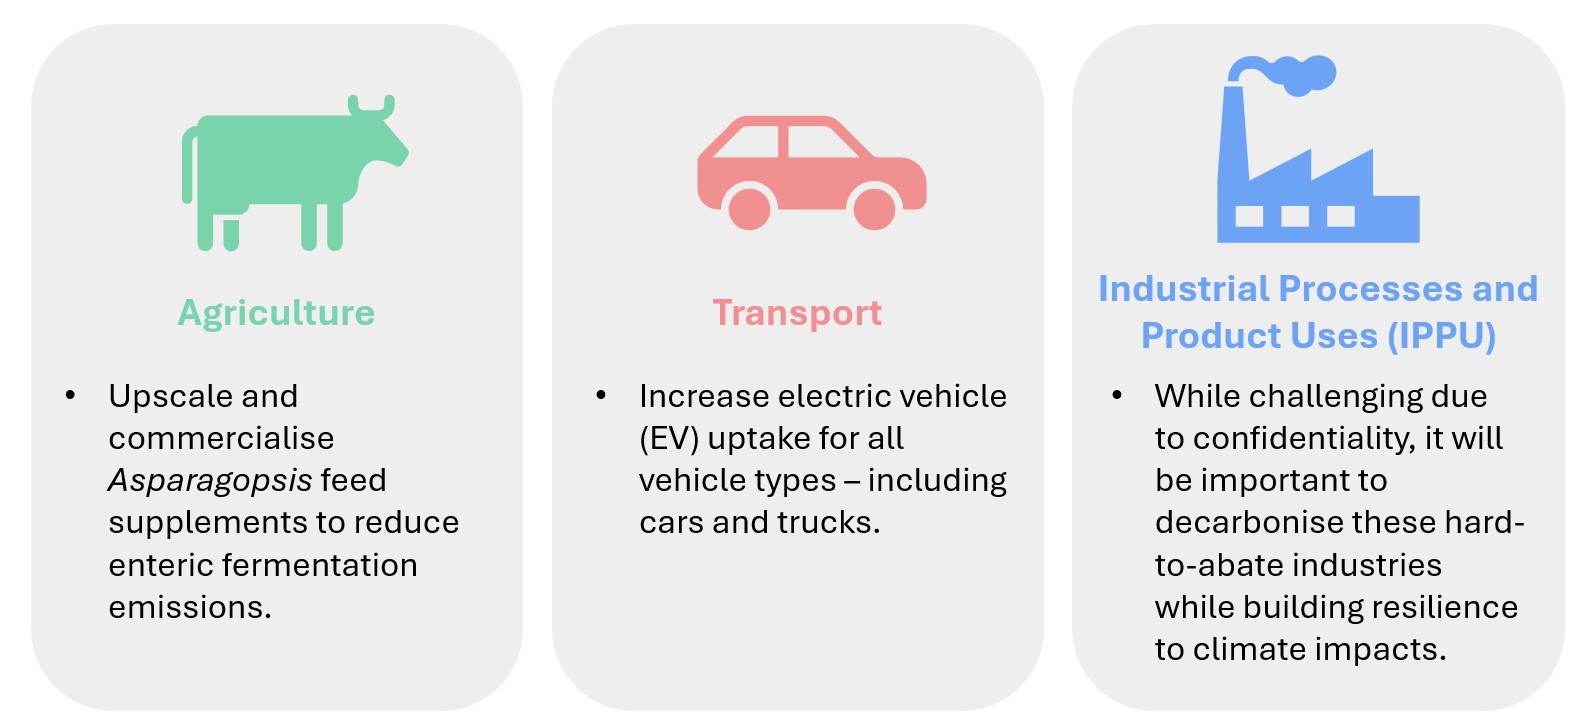
Agriculture
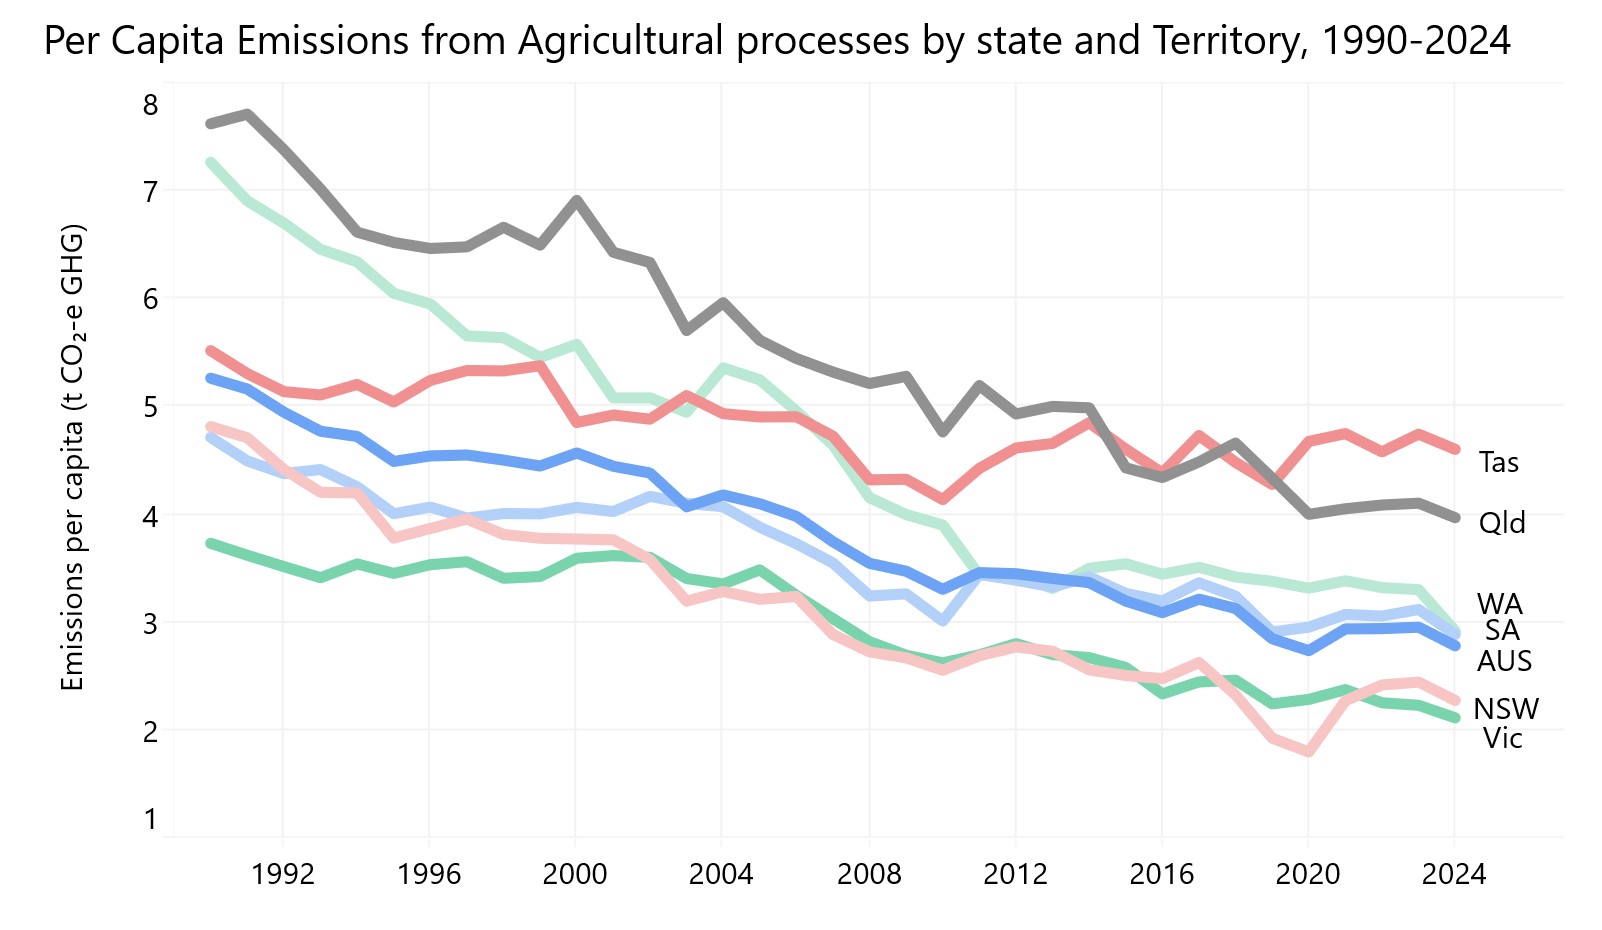
Agriculture is Tasmania's largest source of emissions, accounting for 33% of our absolute emissions. We also have the most emissions-intensive agriculture industry in the country on a per-hectare basis, likely due to our large beef and dairy sectors.
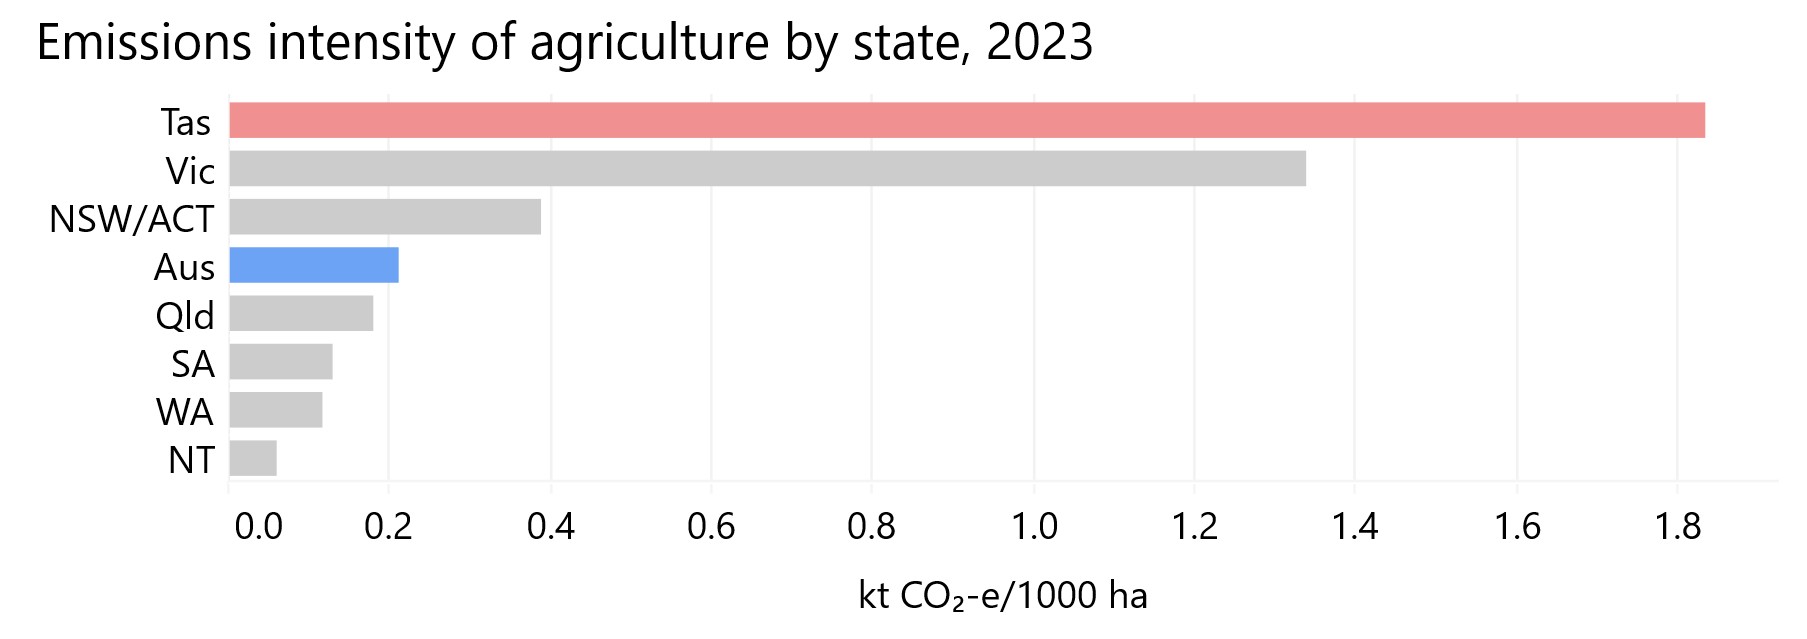
This means that our emissions from
enteric fermentation (the methane produced when cattle digest feed) are very high, accounting for 79.4% of Tasmania's total agricultural emissions. As we said in
last year's update, the biggest opportunity for Tasmania to reduce agricultural emissions lie in
scaling up the use of Asparagopsis (a seaweed added to livestock feed that can cut enteric fermentation emissions by up to 95%).
Transport
Transport is one of our clearest opportunities for emissions reduction –
something we’ve written about extensively. Over the past decade, per capita transport emissions have only fallen by 10.6%. And as the recent fuel crisis has demonstrated, the sector remains heavily dependent on imported fossil fuels. This is both an emissions problem and a strategic risk for the state that requires urgent policy action.

That said, there are reasons for optimism. The fuel crisis has shown that rapid change is possible:
battery electric vehicles reached 20% of new car sales nationally in May 2026, as households began to see EVs as a cheaper long-term choice.
We’ve seen promising growth here in Tasmania too: while the absolute numbers are relatively small, EV registrations between March and May this year were around 70% higher than the same period in 2025 (211 vs. 358).
If we seize the moment by helping to support more public transport use and higher EV uptake, we can consolidate these gains and make real headway on our transport emissions.

Industrial Processes and Product Uses (IPPU)
Tasmania's IPPU sector (which includes emissions from things like chemical processes in manufacturing) accounted for around 17% of our
absolute emissions in the latest inventory, down from 19% in 2023. Even with that decline, we still have the highest IPPU emissions per capita in the country.
The drop in Tasmania’s IPPU emissions is tricky to interpret because much of the sector’s data is not reported in detail to protect commercially sensitive information. This makes it difficult to know if emissions have fallen because industries are making efforts to decarbonise or because of reduced production. Based on lower output from some
under-pressure metals-manufacturing facilities, it seems the latter is more likely.
This is concerning because it means we’re not actually making progress on decarbonising these hard-to-abate industries. The policy challenge here is to do so while building their resilience to climate impacts and minimising the costs of transition for workers and communities.

New policy developments
Since our last update, there have been several important developments in Tasmania’s climate policy landscape:
- The Independent Review of Tasmania’s Climate Change (State Action) Act 2008 – The Review’s Final Report echoed much of what we’ve discussed throughout this article. It found that Tasmania’s net-zero status is fragile and could disappear as early as 2030 under some land-use change scenarios. It also concluded that progress in reducing emissions outside the land sector has been limited and identified shortcomings in the accountability, transparency, and independence of Tasmania’s climate-action policy frameworks. Following the previous review in 2021, the Tasmanian Government made significant changes to the legislation and produced emissions-reduction plans for all STGGI sectors. The Government hasn’t formally responded to the 2025 review yet, and has indicated that it doesn’t believe the changes recommended are necessary.
- Dismantling ReCFIT? – In March, the Government announced major changes to the Department of State Growth. It appears that the main climate, emissions, and energy policy team (Renewables, Climate, and Future Industries Tasmania, or ReCFIT), will be split up: some functions will move to the Department of Premier and Cabinet and others to the Department of Natural Resources and Environment. The long term-implications for this are unclear, but it certainly doesn’t signal a stronger institutional focus on climate policy.
- A Minister for Climate Change – As part of a Cabinet reshuffle on 5 June, the Premier appointed Guy Barnett as Minister for Environment and Climate Change. This is the first time the state has had a dedicated Minister for this area since April 2024. While this is a positive development, it’s not clear how this portfolio will be affected by recent budget cuts and the above mentioned agency changes.
Climate action beyond net zero
2024 marks a decade of net-negative emissions for Tasmania. This is a significant achievement: it means our state has removed around 50,000kt more CO2-e from the atmosphere than it has emitted since 2014.
However, this impressive number also helps to highlight the scale of the challenge we face. Since 1990, Tasmania has emitted about 330,000kt of CO2-e into the atmosphere. If we subtract that 50,000kt of removals, that’s still a net contribution to climate change of 280,000kt (to say nothing of our pre-1990 emissions). At our current rate of carbon removal, it would take us another 62 years to recapture only the CO2-e we’ve emitted since 1990. And as we’ve discussed, maintaining our current rate of carbon removal will become increasingly difficult as our forests mature.
All of this raises a bigger and more challenging question: Net zero was an important milestone, but is it the right end goal for our climate policy? We know from the work of the IPCC that getting to global net zero on current likely timelines will not be enough to guarantee a safe and stable climate. As a result, we’ll need to ‘overshoot’ 1.5 degrees of warming and then work our way back to it over time by removing CO2 from the atmosphere.
In Tasmania, our net zero status is becoming a source of complacency rather than a platform upon which to build a more ambitious climate and emissions policy. Instead of relying on removals, we need to transform our economy so that it produces fewer emissions in the first place. Tasmania has shown that ambitious climate outcomes are possible – but it’s high time to build on our success and take the next step.
This PIMBY is based on our Annual Climate Emissions Update for the reporting year 2024. You can read more about Tasmania's emissions profile - including how we compare in the other sectors -
here or by visiting our website:
www.utas.edu.au/tpe.png)


.png)