Prices and supply
We all know that fuel prices have been rising, but there’s a bit more going on beneath the surface. One important factor is the growing gap between petrol and diesel prices. The cost of diesel has increased by more, and has remained higher, than unleaded petrol (ULP). ULP peaked on 29 March at 50.1% above pre-war prices in regional Tasmania and 55.1% in Hobart. Then prices began falling in response to the Federal Government’s decision to
halve the fuel excise to 20.6 cents per litre on 1 April. As of 12 April, diesel prices have increased by 77.2% in regional Tasmania and 73.9% in Hobart. Although the increase slowed after 1 April, prices didn’t fall in the same way as ULP.

This divergence in prices is important because diesel consumption is more ‘inelastic’ than ULP. Diesel is used for things like freight and commercial transport, which must continue even if prices rise. ULP is mainly used by private vehicle owners, who can reduce their car usage if it gets too expensive (although not always – more on this later).
The chart below shows that diesel demand in Tasmania is now roughly twice that of ULP. This reflects a broader pattern: Australia has
one of the highest rates of diesel consumption per dollar of GDP among the major world economies. This means that while rising petrol prices are painful, rising diesel prices have broader, longer-term economic impacts.

High fuel prices and difficulties
shipping through the Strait of Hormuz have also caused concern about fuel supply in Tasmania. While prices are likely to stay high over the coming months, the state currently has a reasonable level of fuel in reserve. As of
17 April, the state had 100 days’ worth of petrol and 58 days’ worth of diesel on the island. Shipments are expected to continue as normal up until mid-May. So, while the ongoing arrival of new supply is important, there’s no need for major concern at the moment.
How reliant are Tasmanian households on fuel?
As we often say in PIMBY articles, there’s good news and bad news here. On the positive side, Tasmanian households use less fuel per capita than most other states and territories. We have the second lowest rate of petrol sales to retailers (measured as litres per person), which is a proxy for non-commercial fuel use:

And for diesel, we're the lowest of any state or territory:

While this might make it seem as if we’re less reliant on imported liquid fuels than many other states, the reality is more complicated.
In many ways, Tasmanian households are far more exposed to fuel-price spikes than those on the mainland. Our population is very dispersed and public transport options are limited, meaning that for many Tasmanians driving is not optional. According to the 2021 Census, Tasmania was the state with the
highest share of people driving to work (64.6%). This is why we have the highest number of light vehicles per capita – 903 per 1,000 people – of any state or territory. On top of this, Tasmania has the oldest vehicle fleet in Australia – with an average car age of 13.5 years – making it less fuel‑efficient overall.
As a result of these factors, spending on transport makes up a larger share of Tasmanian household budgets than the mainland. On average, transport makes up just over 17% of our expenditure, the second highest of any state or territory.

This might sound like a contradiction: how can Tasmanians have older, less efficient cars and spend a high share of their budget on transport, but still buy less fuel per capita? There are a few things going on here.

On top of this, and unsurprisingly, the fuel crisis is affecting households unevenly. Lower-income households are hit hardest,
as they spend a higher proportion of their budget on fuel. Our analysis of data from the
Household, Income and Labour Dynamics in Australia (HILDA) survey shows that Australia’s poorest households spend around four times more on fuel than wealthy ones, leaving them far less able to absorb sudden price increases without
cutting back on other essentials.

There are also likely to be geographic variations. Tasmanians living in remote and regional areas are typically more reliant on their cars, because they often have to
drive to work or to access services, and have fewer public transport options.
It’s also important to note that the impact on households isn’t going to be confined to extra hip pocket pain when filling up at the bowser. There are several ‘second order’ effects likely to hit Tasmanians over the coming months – and even years. Given Tasmania’s lower average incomes, higher freight costs, and regional population, these second order impacts are likely to be felt more acutely than in the rest of the country.

So, in summary, the fuel crisis is hitting Tasmanian households harder than mainland households; the crunch is being felt most by poorer households and those in regional areas; and we’re highly vulnerable to the second order impacts coming down the pipeline.
How Tasmanian households are reacting
Surprisingly, Tasmanians haven’t significantly changed their behaviour in response to the fuel crisis – at least not yet. Although the Tasmanian Government announced that there were
5,000 extra bus passengers on the first day of the free travel period, traffic data shows that so far, people aren’t driving much less.
A comparison of the pre- and post-war periods shows that the average number of ‘short vehicles’ (cars, vans, cars with trailers) driving across the Tasman Bridge each day has fallen by 4.7% (3,547 vehicles) since February 28.
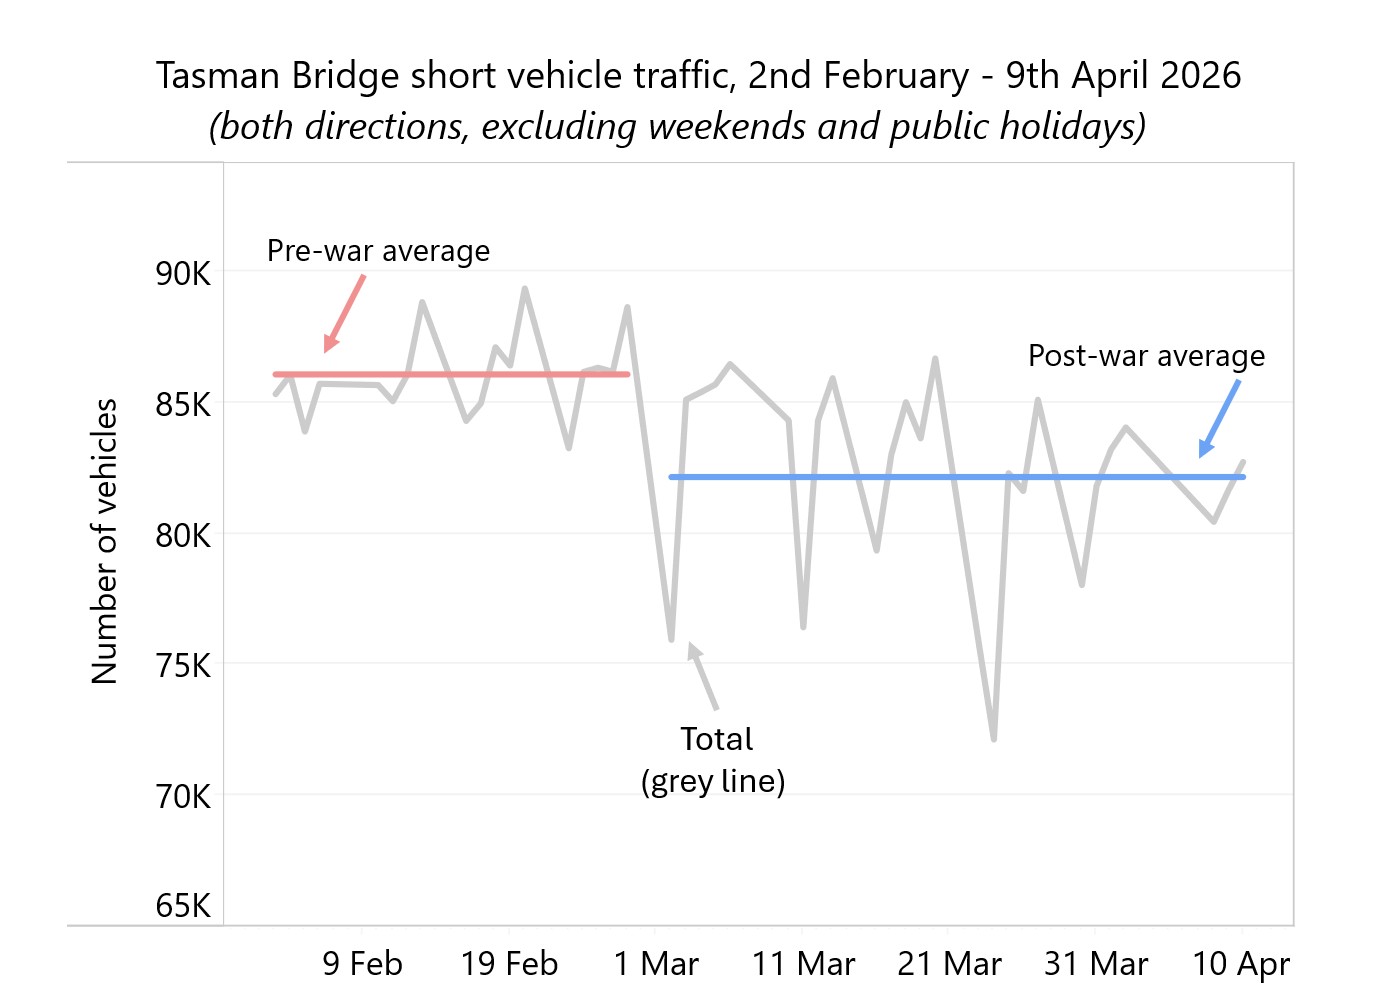
For the equivalent period in 2025, the decline was 1.8% (just under 1,300 vehicles), which can largely be explained by seasonal variations in traffic patterns.
This modest decrease in commuter traffic isn’t as drastic as we might expect given the scale of fuel price increases. There are two possible explanations. Tasmanians may be continuing to drive because they don’t have viable public transport alternatives. Or, they may be willing to bear the higher costs for the sake of convenience – again, at least for now.
What about Tasmanian industry?
The fuel crisis is also bad news for some of Tasmania’s most important industries. Before getting into how specific industries are impacted by fuel-price spikes, it’s important to understand where different parts of Tasmania’s economy get their energy from.
Despite being mostly self-sufficient in renewable electricity, we still depend heavily on fossil fuels – most of which are imported. Electricity, rooftop solar, and woody biomass account for around 47% of our total energy use. The other 53% is from diesel, petrol, gas, and coal.
As a result, key sectors of our economy are highly exposed to changes in fuel prices. The industries most dependent on diesel and petrol are agriculture, forestry, and fishing; manufacturing; mining; and transport.

This is a big problem for a few reasons. First, these industries are more important to Tasmania’s economy than they are nationally, either because they employ more people locally or contribute more to the state economy, or both. Second, they are heavily dependent on liquid fuels and can’t easily or quickly adjust their operations when prices rise (in other words, demand for fuel in these sectors is relatively ‘inelastic’). Third, some of these industries are also more fuel-intensive here than they are on the mainland.
This means that the fuel crisis is a double whammy for important parts of Tasmania’s economy: some of the state’s most fuel-intensive industries are both more important to the state economy and more reliant on liquid fuels than they are elsewhere in the country.
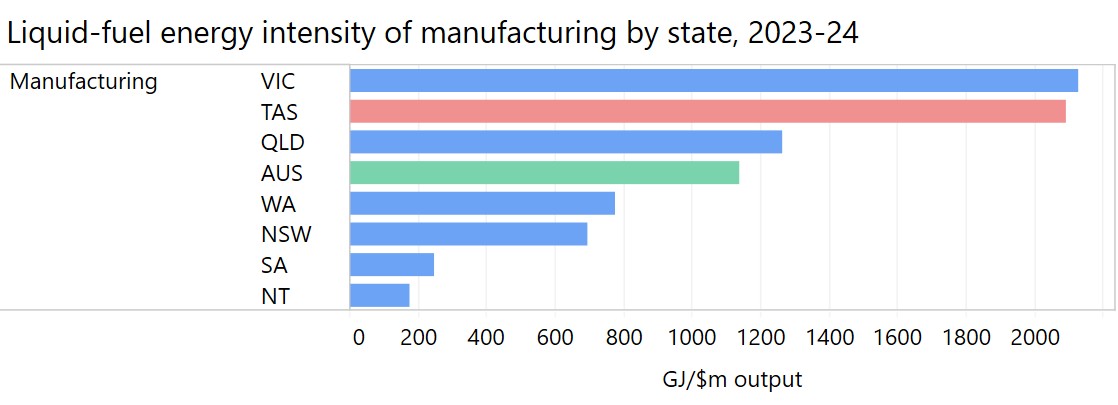
Tasmania's manufacturing sector is a case in point. Manufacturing employs a slightly larger share of the Tasmanian workforce than the national average and produces roughly the same share of output, but uses around 80% more refined petroleum products.
It’s important to note that these impacts are compounded by our reliance on road freight. The state’s economy and community depend on an efficient road freight industry, and the sector employs around 10,000 workers. Skyrocketing diesel prices are already putting some operators under extreme strain.
A gigajoule (GJ) is a unit of
measurement of energy consumption. 1 GJ is equivalent to 1000 megajoules (MJ).
To put this into perspective: Diesel produces around
41 MJ of energy per litre, and petrol produces around
36 MJ of energy per litre.
Mark Kable, Managing Director of vegetable grower Harvest Moon,
told the ABC that “[it] may get to that point where we won't harvest broccoli or cauliflower” due to the additional cost of transporting produce to retail outlets.
The ABC
also reported that higher diesel prices through March increased the fuel bill of Page Transport – one of Tasmania's largest livestock carriers – by over $150,000.
Our modelling shows that a 30% increase in the price of diesel increases the lifetime cost of owning most standard truck types by between 10% and 32%. If high prices continue, this will place significant cost pressures on Tasmanian transport businesses and the industries that depend on them.
One silver lining for greenhouse gas emissions is that a very high fuel price might improve the economics of electric freight vehicles. For some truck types, a high diesel price can even mean that battery-electric alternatives may begin to approach or exceed cost-parity with diesel. This creates an opportunity for targeted support to accelerate the transition to more sustainable electric alternatives.

Finally, it’s worth quickly mentioning tourism, which directly
employs around 16,500 Tasmanians and contributed some $3 billion to the state’s economy in 2023-24. As a sector, it’s very vulnerable on two fronts. First, getting to Tasmania is already becoming more expensive. In response to rising fuel prices, domestic airline fares have become
wildly volatile, and there’s been a
15% surcharge on Spirit of Tasmania tickets since 31 March. Second, getting around the state has become much more expensive, which affects Tasmanian’s holidaying on-island and visitors road-tripping once they get here. And third, in uncertain times people are less likely to go on holiday because they’re trying to reduce their spending on non-essential things.
Tourism businesses, particularly those in remote areas, are
already reporting cancellations. However, there’s some hope that a drop in international visitors might be counteracted by Australians choosing cheaper holidays to places like Tassie over expensive international trips.
Of course, over the longer term, our very heavy dependence on fossil fuels like diesel and petrol (not to mention coal) in many of our most important industries is yet another powerful argument for decarbonisation and more renewable energy generation. In the grips of a short-term fuel crisis, however, it is an acute economic challenge for the state and its workers.
Conclusion
Unfortunately, it doesn’t look like high fuel prices – and price volatility – are going anywhere soon. And that’s bad news for both Tasmanian households and some of our key industries. Tasmania’s relatively small economy means that negative impacts on a few vital sectors have big knock-on effects for the rest of the state – and without early intervention, the situation can spiral dangerously.
Fortunately, there are policies and programs that could help the hardest hit households and industries navigate through this tough situation. So, as promised, in the
next instalment of this series, we’ll take an in-depth look at some of the things that Tasmania could do to weather the storm.
This article uses unit record data from Household, Income and Labour Dynamics in Australia Survey [HILDA] conducted bythe Australian Government Department of Social Services (DSS). The findings andviews reported in this article, however, are those of the authors and shouldnot be attributed to the Australian Government, DSS, or any of DSS’ contractorsor partners. DOI:
https://doi.org/10.26193/6M1BMR Correction: an earlier version of this article misstated the fuel intensity of Tasmania's agriculture sector.
.png)


.png)